Sales Dashboard: 12 Key Indicators and Model to Follow
Voici les deux règles fondamentales à garder en tête lors de la mise en place de votre prochain challenge commercial. Ce retour d'expérience se base sur une enquête réalisée auprès de responsables commerciaux, organisateurs et participants aux challenges.


Sommaire
One commercial dashboard modern is no longer limited to traditional financial KPIs. In 2026, he simultaneously manages internal teams, supplier networks and distributors, and he integrates gamified engagement indicators that predict performance before it even translates into sales. It is this combination that distinguishes a descriptive dashboard from an animation dashboard, and this is precisely where the difference between noticing and acting comes into play.
This article details the 12 essential indicators that make up a comprehensive business dashboard, organized into four families: financial, activity, engagement, and external networks. For each KPI, you will find the formula, the recommended update frequency and the concrete action lever it triggers. To activate your teams around these indicators in real time, the Objow objective management solution connects to your existing CRM and ERP to transform the data they centralize into challenges, rankings and visible objectives on a daily basis.
Why the modern sales dashboard exceeds traditional KPIs
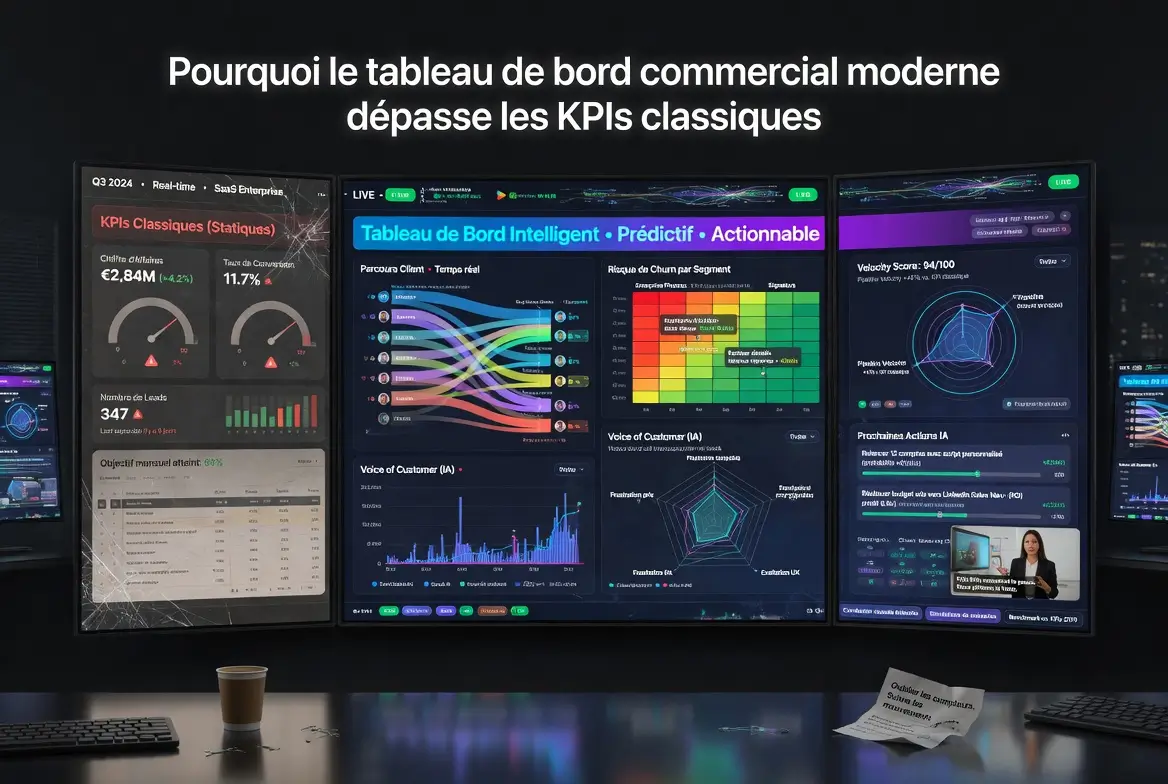
The commercial dashboard of 2026 is intended to be an animation tool, not just a reporting tool. In concrete terms, a dashboard that simply displays monthly turnover produces a rear-view effect: the data arrives too late to correct the situation. Therefore, successful sales departments now integrate predictive indicators (weighted pipeline, velocity, transformation rate per stage) and gamified engagement metrics (participation in challenges, real-time rankings, unlocked badges) that anticipate future performance.
According to a Salesforce State of Sales 2025 survey of 5,500 sales departments, 68% of organizations that combine financial KPIs and gamified engagement indicators exceed their annual goals, compared to 41% for those who only drive the result. In addition, the gap widens even more when the dashboard integrates external networks: partners, distributors, franchisees. This is why the scope of the modern dashboard is extended to business providers.
- Financial indicators : turnover, margin, average basket, ARR for subscription models
- Activity indicators : call volumes, appointments, quotes, contracts signed
- Commitment indicators : participation challenges, rankings, badges, points
- External network indicators : sell-out partners, distributor activation rate, franchisee performance
- Management indicators : transformation rate, pipeline speed, average cycle time
In other words, a powerful dashboard balances financial reading (result) with behavioral reading (activity and engagement). This double vision allows sales departments to intervene upstream, on the levers that feed the figure, rather than downstream on the result itself.
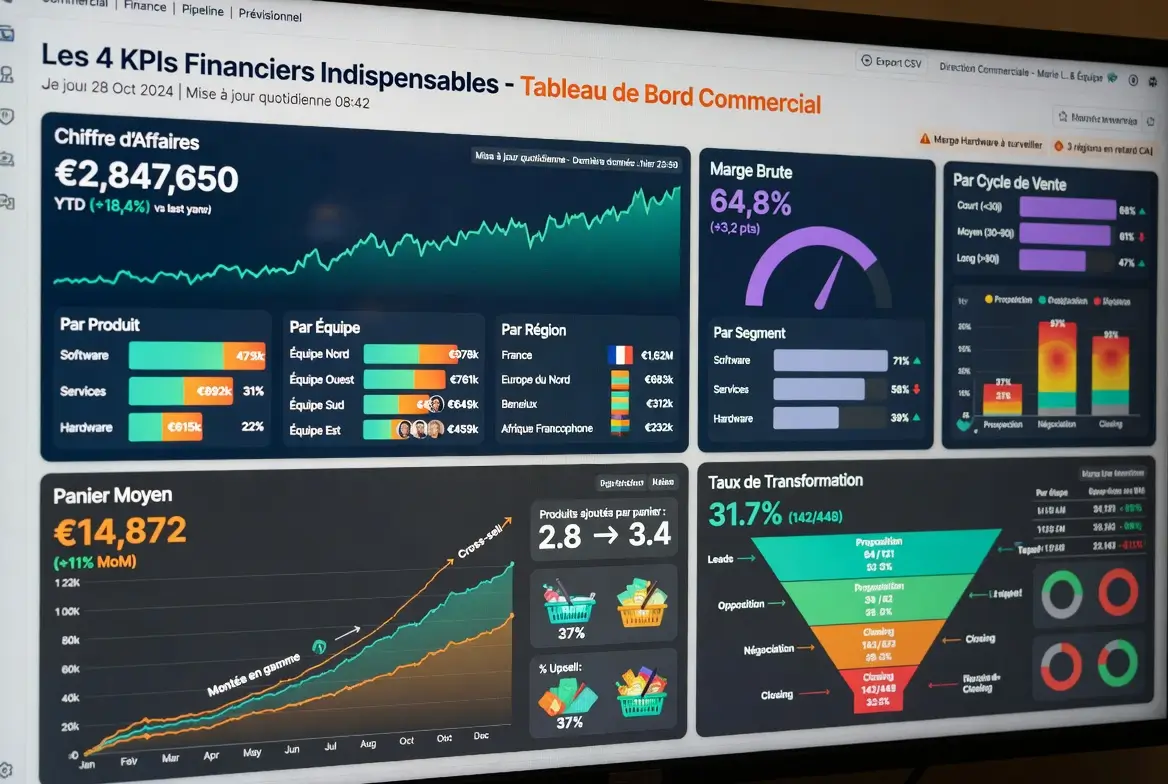
The 4 financial KPIs essential to the sales dashboard
Financial KPIs remain the foundation of everything commercial dashboard, but reading them should be structured. Indeed, displaying gross sales without breaking it down by product, segment, team and network deprives management of a detailed understanding of performance. This is why the four indicators below should be integrated systematically, with a daily update for field teams and weekly for management management.
Concretely, the Pierre Martinet case documents this logic. In its CRM and ERP, the FMCG brand tracks a turnover segmented by product reference, by brand and by geographical area. Once these segments are connected to Objow, each sub-perimeter becomes a gamified objective, classified and animated in real time with field sales representatives. Result: +30% in PDL in three months on a targeted panel and a POS installation rate increased from 75% to 99%, because the real-time rankings highlighted the differences in the objective and triggered immediate action.
- Turnover : segmented by product, team, region, daily update
- Gross margin : by segment and by sales cycle, to manage real profitability
- Average basket : upmarket and cross-sell indicator, monthly
- Conversion rate : opportunities won out of total opportunities, by pipeline stage
In addition, these four financial KPIs benefit from being displayed with their evolution over 12 rolling months and their deviation from the objective. The feeling of urgency and progression, two motivational drivers documented by behavioral science research, depend directly on this perspective. Note that the frequency of updates determines usability: a dashboard that is refreshed monthly does not have the same operational value as a real-time dashboard.
The 4 business indicators that really drive sales performance
Business metrics measure what salespeople do, as opposed to what they get. This distinction is central because the activity always precedes the result by several weeks. Therefore, following only the result is the same as driving by looking at the rearview mirror. The four indicators below, integrated into the dashboard with daily refreshment, provide predictive visibility over the coming weeks.
In fact, a salesperson who makes 40 qualified calls per day generates, on average, 8 times more opportunities than a salesperson who makes 5 qualified calls per day. This correlation between business volume and pipeline is documented by HubSpot in its Sales Productivity 2025 report on 12,000 sales teams. Activity monitoring, read from the CRM and then transformed by Objow into weekly challenges on call volume, increased the number of opportunities created at Manpower by 32% since deployment.
- Qualified call volume : per sales person and per day, predictive pipeline indicator
- Number of appointments : held against schedule, no-show rate included
- Quotations issued and relaunched : with reminder date and conversion probability
- Pipeline velocity : average duration of an opportunity per stage, identifies bottlenecks
Concretely, these indicators feed the weekly coaching conversation with each salesperson. The animation layer is not only used to pilot, it becomes a tool for managing individual performance. This is why connecting it to the CRM is essential: the data must be sent back automatically, without manual entry, otherwise the salesperson loses 30 minutes a day feeding a table that he does not consult.
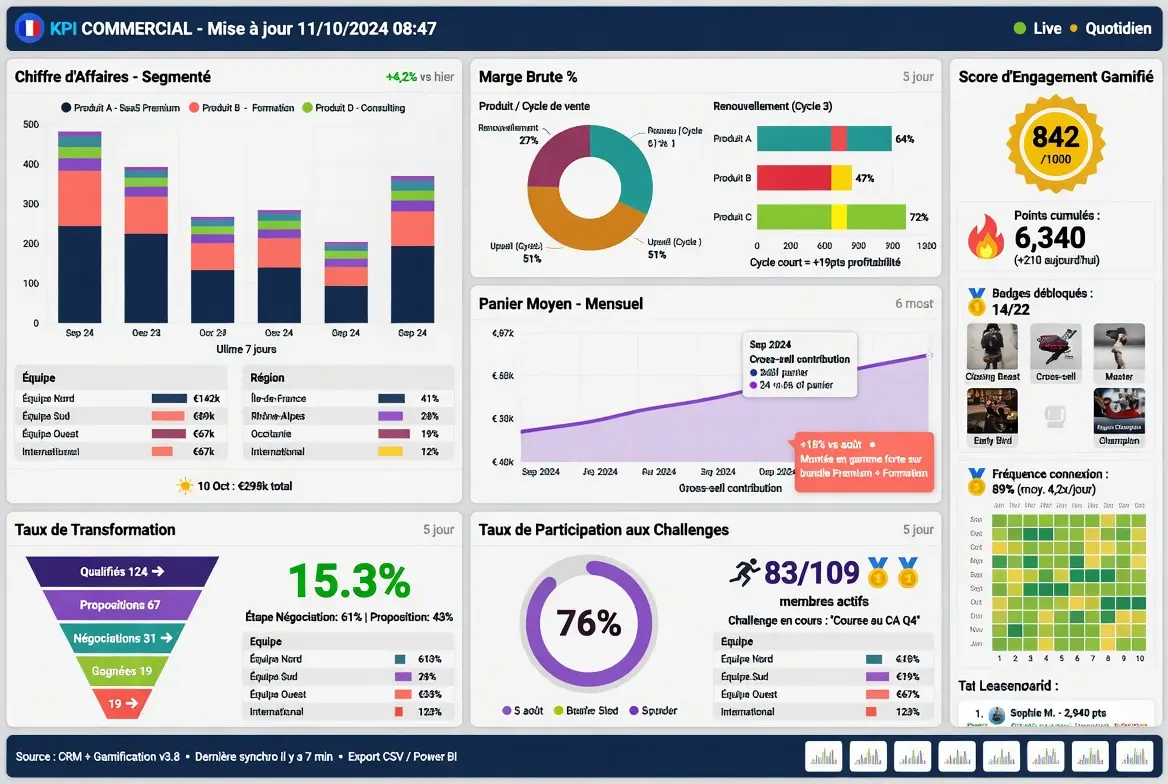
The 2 gamified engagement indicators you should definitely integrate
Gamified engagement indicators measure the intensity of teams' participation in animation systems. They have become indispensable because they predict performance even before it is translated into numbers. In fact, a salesperson who consults his ranking in real time several times a day and who regularly unlocks badges shows 23% more commercial activity than a salesperson who is disengaged from the system (Objow internal study on 25,000 users).
In addition, these two indicators offer a valuable warning signal. When the participation rate in challenges falls below 60%, experience shows that commercial performance will follow within 4 to 6 weeks. Management can then intervene: adjust rewards, vary the mechanics, relaunch targeted communication. Without these engagement metrics, the alert comes too late.
- Challenge participation rate : percentage of the team active on current challenges
- Gamified engagement score : composite including accumulated points, unlocked badges, connection frequency
To deepen the subject of the gamification mechanisms that feed these indicators, the dedicated article on 5 most effective gamification mechanisms in B2B details the levers (rankings, badges, challenges, challenges, bars, boosters) to be activated in the animation device.
The 2 external network indicators that are transforming distributor activity
The management of external networks (partners, distributors, franchisees, business providers) requires two specific indicators that the commercial dashboard Classic ignore. Partner sell-out measures the volume of final sales made by resellers, downstream of the sell-in (what you sell to them). The distributor activation rate measures the share of partners who sold over the period, as opposed to those who are registered but inactive.
This distinction is critical because a network of 200 distributors with a 60% activation rate produces the same result as a network of 120 distributors with a 100% activation rate, at very different animation costs. Therefore, steering distributors on sell-out and activation, rather than sell-in, orients animation budgets towards partners who really have the potential to grow.
- Sell-out partners : volume of final sales by distributor, monthly or weekly
- Distributor activation rate : percentage of active partners over the period, monthly
Concretely, the Manpower case documents a 16% increase in the number of active customers after deploying an animation system segmenting the networks of providers on these two indicators. This is why a modern sales dashboard treats distributors and franchisees as a full-fledged sales force, with its own KPIs and its own animation devices. To go further on this subject, the article onanimation of a network of providers details the levers to be activated.
Summary table of the 12 indicators of the sales dashboard
The table below summarizes the 12 essential indicators of commercial dashboard modern, with their update frequency, their family and the main action lever they trigger. Note that all these indicators are calculated and stored in your CRM, ERP or BI tool; the role of an animation platform like Objow consists in reading them continuously to transform them into challenges, rankings and awards visible to the teams.
This model has been deployed at over 50 Objow client organizations. To adapt this system to your specific context (B2B SaaS, retail, bank-insurance, distribution), the Stimulate internal teams page details the variants by use case.
How to connect the sales dashboard to CRM and SFA
One commercial dashboard modern is not fed by manual input. The data must be automatically sent back from the CRM (Salesforce, HubSpot, HubSpot, Pipedrive, Monday) and the SFA (Sales Force Automation), in real time or at least every hour. Without this native integration, salespeople lose 20 to 40 minutes a day updating fields, and data quality drops in a few weeks.
Concretely, Objow connects to the major CRMs on the market via native connectors. CRM remains the source of business truth and continues to centralize opportunities, accounts, and activities. Objow reads this data continuously to transform it into challenges, real-time rankings, badges and objectives visible to teams on a daily basis. The platform does not replace your CRM, it connects to it to add the layer of incentive and engagement that is often lacking in purely analytical dashboards.
In the end, the value of an integrated device does not come from the indicators themselves but from their ability to trigger actions. This is why a successful sales dashboard must display, next to each KPI, the corresponding lever of action: challenge to launch, coaching to program, partner to relaunch. To implement this integrated system in your organization, Request a free Objow demo and talk to a consultant about your context.
Frequently asked questions about the sales dashboard
What is the ideal number of indicators on a sales dashboard?
One commercial dashboard effective contains between 10 and 15 indicators, structured in four families (financial, activity, commitment, external networks). Below 10, the steering lacks finesse and some levers go under the radar. Above 15, cognitive overload dominates and the dashboard becomes unreadable. The practical rule is to display only the KPIs that trigger a concrete action: if an indicator does not control anything, it has no place in the dashboard. The 12 indicators detailed in this article correspond to the base deployed by Objow's client organizations.
How often should a sales dashboard be refreshed?
The frequency depends on the nature of the indicator. Activity (calls, appointments, quotes) and gamified engagement (participation, rankings) and gamified engagement (participation, rankings) should be in real time or refreshed every hour. Financial KPIs (turnover, average basket) benefit from being daily for operational management and weekly for management. External network indicators (sell-out partners, distributor activation) are monthly because the feedback flows from distributors do not help better. Overall, a modern device combines several frame rates on the same interface.
Which CRMs integrate natively with a sales promotion system?
The main CRMs on the market integrate natively with modern sales management platforms: Salesforce, HubSpot, Pipedrive, Monday CRM, Microsoft Dynamics 365 and Zoho. The integration allows the animation platform to automatically read the opportunities, accounts, activities and contacts stored in the CRM, then transform them into gamified challenges and indicators visible by the teams in real time. CRM maintains its role as a source of commercial truth; Objow connects to it to add the incentive, gamification and recognition layer that activates teams on a daily basis.
How do you integrate external networks into the sales dashboard?
The integration of external networks involves two specific indicators: partner sell-out (volume of final sales per distributor) and the distributor activation rate (share of partners active over the period). These indicators are to be displayed in a dedicated section of the dashboard, with granularity by partner and by geographic area. Concretely, the animation of distributors and franchisees imposes its own mechanisms (sell-out challenges, progressive badges, regional rankings) which must be managed by the animation system. The Manpower case documents +16% of active customers after deploying this approach.
Should the sales dashboard show gamified rankings?
Yes, as long as rankings are structured to avoid toxic competition. A modern system integrates several parallel rankings (by region, by product, by account size, by relative progression) so that each employee is top in at least one ranking. This plurality maintains the motivation of employees at the bottom of the overall ranking. The gamified engagement score complements the rankings. To deepen the best practices on this subject, the dedicated article on B2B gamification mechanics details the variants to be activated.
What ROI can you expect from a modern sales dashboard?
Organizations that deploy a commercial dashboard integrated (financial + activity + commitment + external networks) with real-time sales animation see an average of +27% in turnover over 12 months according to the Salesforce State of Sales 2025 study. On the Objow perimeter specifically, the 25,000 users deploy devices that produce +83% engagement, +60% operational time savings and +18% improvement in business KPIs. The ROI depends on the quality of the connection between the animation platform and the CRM, and on the animation around the KPIs, not on the dashboard alone.
Setting up a modern sales dashboard is one of the most profitable performance levers for a sales department in 2026. To scope the project on your specific context and explore the CRM integrations available, Request an Objow demo and talk with our team.
This model has been deployed at over 50 Objow client organizations. To adapt this dashboard to your specific context (B2B SaaS, retail, bank-insurance, distribution), the Stimulate internal teams page details the variants by use case.
How to connect the sales dashboard to CRM and SFA
One commercial dashboard modern is not fed by manual input. The data must be automatically sent back from the CRM (Salesforce, HubSpot, HubSpot, Pipedrive, Monday) and the SFA (Sales Force Automation), in real time or at least every hour. Without this native integration, salespeople lose 20 to 40 minutes a day updating fields, and data quality drops in a few weeks.
Concretely, Objow offers native connectors with the major CRMs on the market. The raw data (opportunities, accounts, activities) is fed back continuously, transformed into KPIs and displayed in the dashboard with layers of gamified animation on top. This architecture combines the two worlds: analytical management and behavioral animation, in a single tool used daily by the teams.
In the end, the value of the dashboard does not come from the indicators themselves but from their ability to trigger actions. This is why a successful sales dashboard must display, next to each KPI, the corresponding lever of action: challenge to launch, coaching to program, partner to relaunch. To implement this integrated system in your organization, Request a free Objow demo and talk to a consultant about your context.
Frequently asked questions about the sales dashboard
What is the ideal number of indicators on a sales dashboard?
One commercial dashboard effective contains between 10 and 15 indicators, structured in four families (financial, activity, commitment, external networks). Below 10, the steering lacks finesse and some levers go under the radar. Above 15, cognitive overload dominates and the dashboard becomes unreadable. The practical rule is to display only the KPIs that trigger a concrete action: if an indicator does not control anything, it has no place in the dashboard. The 12 indicators detailed in this article correspond to the base deployed by Objow's client organizations.
How often should a sales dashboard be refreshed?
The frequency depends on the nature of the indicator. Activity (calls, appointments, quotes) and gamified engagement (participation, rankings) and gamified engagement (participation, rankings) should be in real time or refreshed every hour. Financial KPIs (turnover, average basket) benefit from being daily for operational management and weekly for management. External network indicators (sell-out partners, distributor activation) are monthly because the feedback flows from distributors do not help better. Overall, a modern dashboard combines several frame rates on the same interface.
Which CRMs integrate natively with a gamified sales dashboard?
The main CRMs on the market integrate natively with modern sales management platforms: Salesforce, HubSpot, Pipedrive, Monday CRM, Microsoft Dynamics 365 and Zoho. The integration allows the automatic repatriation of opportunities, accounts, activities and contacts into the dashboard, with a real-time update. It is this automation that distinguishes a dashboard that is really usable from a shared Excel file. Objow offers these native connectors and the data feeds both the control layer and the gamification layer in the same interface.
How do you integrate external networks into the sales dashboard?
The integration of external networks involves two specific indicators: partner sell-out (volume of final sales per distributor) and the distributor activation rate (share of partners active over the period). These indicators are to be displayed in a dedicated section of the dashboard, with granularity by partner and by geographic area. Concretely, the management of distributors and franchisees imposes its own mechanisms (sell-out challenges, progressive badges, regional rankings) which must be managed by the dashboard. The Manpower case documents +16% of active customers after deploying this approach.
Should the sales dashboard show gamified rankings?
Yes, as long as rankings are structured to avoid toxic competition. A modern dashboard integrates several parallel rankings (by region, by product, by account size, by relative progression) so that each employee is top in at least one ranking. This plurality maintains the motivation of employees at the bottom of the overall ranking. The gamified engagement score complements the rankings. To deepen the best practices on this subject, the dedicated article on B2B gamification mechanics details the variants to be activated.
What ROI can you expect from a modern sales dashboard?
Organizations that deploy a commercial dashboard integrated (financial + activity + commitment + external networks) with real-time sales animation see an average of +27% in turnover over 12 months according to the Salesforce State of Sales 2025 study. On the Objow perimeter specifically, the 25,000 users deploy indicators that produce +83% engagement, +60% operational time savings and +18% improvement in business KPIs. The ROI depends on the quality of the CRM integration and the animation around the dashboard, not on the dashboard alone.
Setting up a modern sales dashboard is one of the most profitable performance levers for a sales department in 2026. To scope the project on your specific context and explore the CRM integrations available, Request an Objow demo and talk with our team.


.webp)