Sales Pipeline: Definition, 5 Stages, and Management Method
Voici les deux règles fondamentales à garder en tête lors de la mise en place de votre prochain challenge commercial. Ce retour d'expérience se base sur une enquête réalisée auprès de responsables commerciaux, organisateurs et participants aux challenges.

Sommaire
The sales pipeline is the central management tool for any modern sales department. It represents, at any given moment, all ongoing opportunities, organized by progression stage, with their estimated value and conversion probability. Specifically, the pipeline answers three critical questions: how much revenue is in the pipeline, where are the bottlenecks, and which opportunities are at risk of falling behind schedule. Without a structured pipeline, these questions remain intuitive, and management becomes reactive.
This article defines the sales pipeline in its 2026 understanding, details the 5 standard stages of the B2B sales cycle, presents essential KPIs, and best management practices. The perspective is resolutely operational, focusing on pipeline animation, which transforms a reporting tool into a performance driver. To integrate an animated sales pipeline into your organization, the Objow objective management solution connects to your existing CRM to leverage ongoing opportunities and activate animation levers on top of it.
Sales Pipeline Definition in 2026
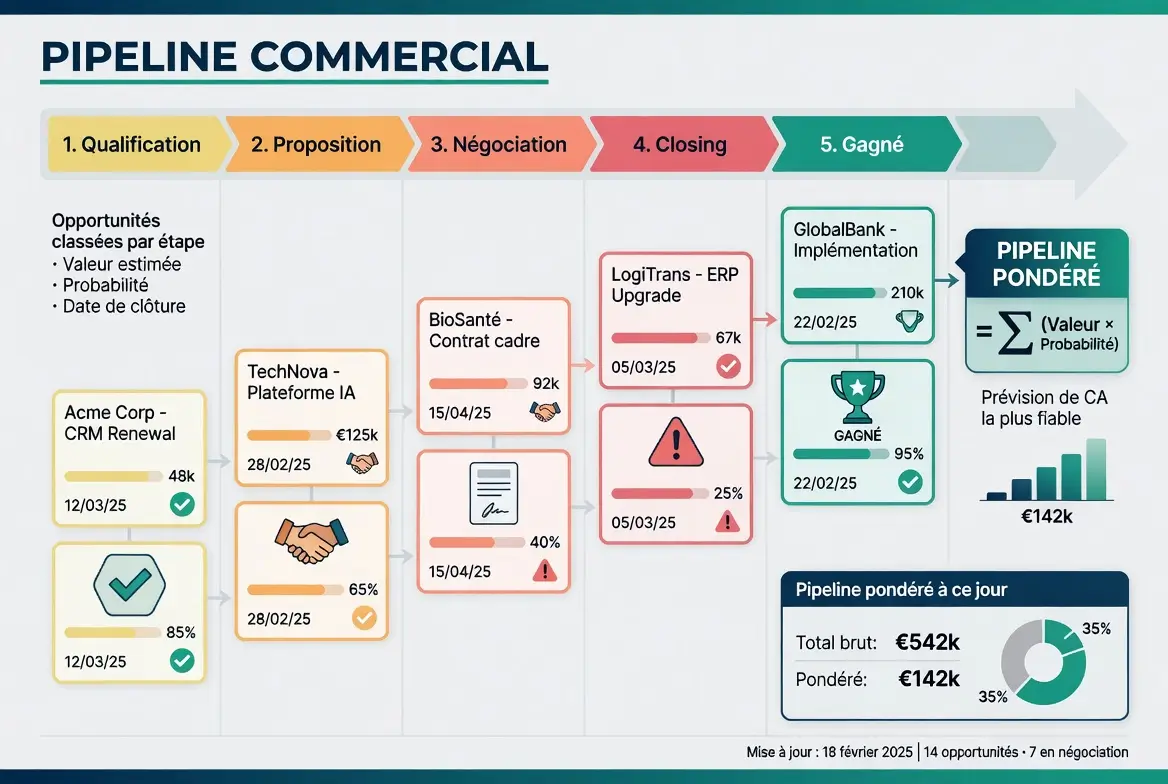
The sales pipeline refers to the structured list of ongoing sales opportunities, classified by progression stage in the sales cycle, with each opportunity having an estimated value, a conversion probability, and a projected closing date. This structure allows for the calculation of the weighted pipeline (sum of opportunities × their probability), which represents the most reliable revenue forecast available at any given time.
Furthermore, the modern pipeline goes beyond a simple list: it becomes an animation tool when coupled with stage-based rankings, velocity challenges, and automatic alerts for at-risk opportunities. This animation dimension is what distinguishes a 2026 sales pipeline from a mere CRM report. The raw data remains the same, but its dynamic application differs.
- Opportunity list : all ongoing potential sales, classified by stage
- Value and probability : each opportunity has an estimated amount and a conversion rate
- Closing date : projected, to be updated with each change
- Weighted pipeline : sum of value × probability, revenue forecast
- Animated pipeline : layer of rankings, challenges, and alerts integrated into the CRM
In practice, a healthy sales pipeline typically shows 3 to 4 times the value of the target for the period in question. A pipeline that is too lean indicates a deficit in lead generation, while an overloaded pipeline signals a lack of qualification or follow-up. This quantitative analysis allows sales departments to anticipate peaks and troughs in activity.
The 5 Standard Stages of a B2B Sales Pipeline
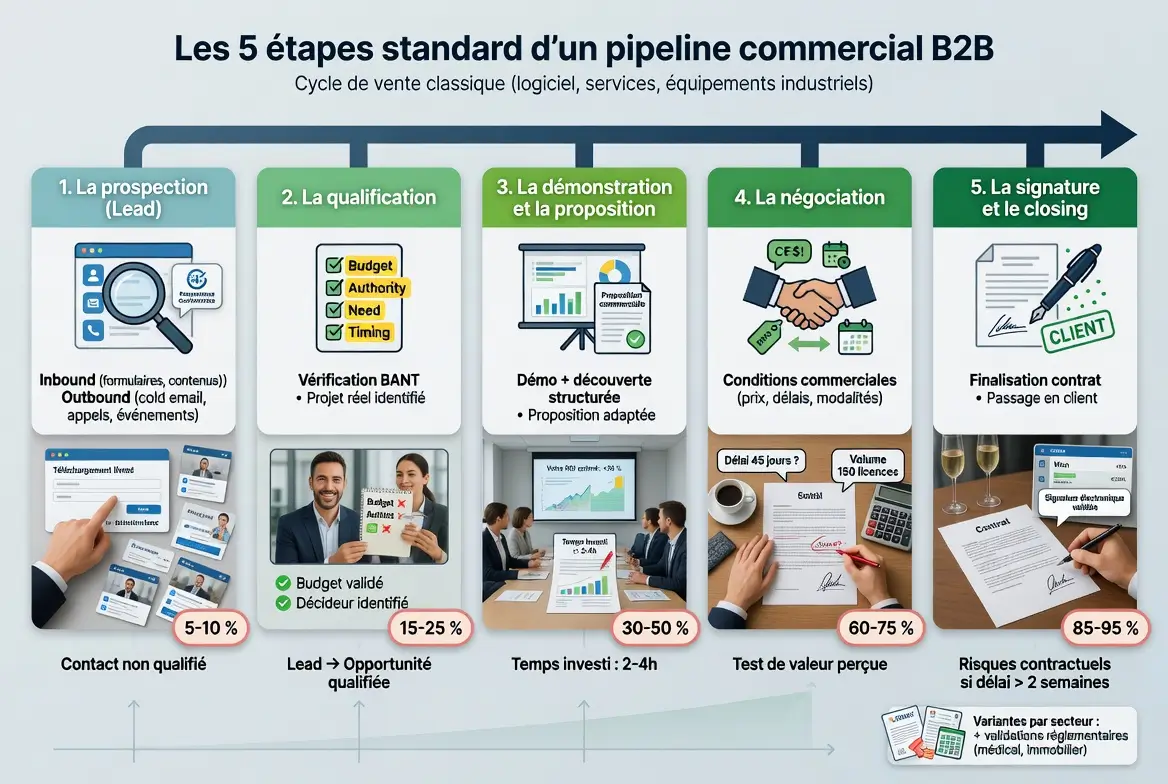
B2B sales pipelines generally follow 5 standard stages, with variations by sector. The structure below corresponds to the majority of classic B2B sales cycles (software, services, industrial equipment). Note that some sectors (commercial real estate, medical equipment) add extra stages related to regulatory or technical validations.
Stage 1: Prospecting (lead)
Identify contacts who could become customers, via inbound (website forms, downloaded content) or outbound (cold email, telemarketing, events). Typical conversion probability: 5 to 10%. At this stage, the opportunity is not yet an opportunity in the strict sense; it's a lead to be qualified.
Stage 2: Qualification
Verify that the lead matches your target (BANT: Budget, Authority, Need, Timing) and that there is a real project. Conversion probability: 15 to 25%. This stage filters leads and elevates qualified contacts to opportunity status. Specifically, a lead not qualified on all 4 BANT criteria has little chance of becoming a customer.
Stage 3: Demonstration and Proposal
Present the solution, understand the prospect's precise needs, and prepare a tailored commercial proposal. Conversion probability: 30 to 50%. At this stage, the salesperson invests significant time (2 to 4 hours per opportunity), and the stakes become clearer. A structured discovery plan strongly influences the subsequent conversion rate.
Stage 4: Negotiation
Align commercial terms (price, deadlines, conditions) with the client. Conversion probability: 60 to 75%. This stage tests perceived value: if the proposal is solidly built, negotiation remains focused on the terms, not on the principle of purchase. A tough price negotiation is often a symptom of insufficient discovery in Stage 3.
Stage 5: Signature and Closing
Finalize the contract and convert the opportunity into a customer. Conversion probability: 85 to 95%. At this stage, opportunities that fall behind schedule are due to contractual risks (legal, internal prospect validation) rather than commercial issues. Specifically, a closing that drags on for more than 2 weeks after a verbal agreement signals a risk that needs active management.
Why the Classic Sales Pipeline Underperforms
Three recurring pathologies weaken the performance of a sales pipeline classic pipeline. The first is deficient qualification: opportunities accumulate in the early stages without converting because the qualification filtering is too lax. The second is stagnation: opportunities remain stuck at the same stage for several weeks, without follow-up or progression. The third is salesperson optimism: declared probabilities systematically overestimate actual conversion, which distorts revenue forecasts.
According to a Pipedrive 2025 analysis of 800 B2B organizations, 47% of opportunities declared in Stage 4 (negotiation) do not close within the subsequent 90 days, revealing a structural optimism bias. The countermeasure is to anchor each stage to objective criteria (proposal sent, demo completed, documented verbal agreement) rather than on the salesperson's feeling. This qualification discipline increases the actual conversion rate by 15 to 25%.
- Deficient qualification : 47% of opportunities declared in negotiation do not close within 90 days
- Invisible stagnation : opportunities stuck for several weeks without automatic alerts
- Salesperson optimism : probabilities overestimated by 15 to 25% on average according to Pipedrive
- Incomplete data entry : 30 to 40% of activities are not reported in the CRM due to lack of discipline
- Lack of animation : the pipeline is consulted for reporting but not managed daily
Consequently, modern sales departments supplement the pipeline structure with a layer of animation and automatic alerts. This approach transforms the reporting tool into an operational management tool.
How to Animate the Sales Pipeline to Accelerate Velocity
The animation of the sales pipeline relies on four complementary levers. The first is real-time stage-based display: each salesperson sees their classified opportunities and can compare their pipeline to that of their peers, without benefiting from reporting biases. The second is the velocity challenge: a weekly goal for opportunities to progress from one stage to the next. The third is the alert system: any opportunity stagnant for more than 14 days triggers a follow-up notification. The fourth is the final sprint, which mobilizes the team on the most advanced opportunities at the end of the period.
Specifically, these four levers are implemented as an overlay to the existing CRM. Raw data (opportunities, stages, amounts) remains in Salesforce, HubSpot, Pipedrive, or monday. The Objow animation layer leverages this data to produce rankings, challenges, and alerts accessible to the salesperson within the same tool as their pipeline. This native integration is what makes daily animation sustainable.
- Stage-based rankings : top 5 salespeople by value of opportunities in negotiation, for example
- Velocity challenges : weekly goal of N opportunities progressed one stage
- Stagnation alerts : opportunity stagnant for 14 days triggers a follow-up
- Final sprint : mobilization on Stage 4 and 5 opportunities during the last 2 weeks
- Progression badges : "First closing of the month", "10 qualified opportunities", "Top velocity"
The documented effect of this approach: +28% pipeline velocity and +19% overall conversion rate according to HubSpot Sales Productivity 2025. Specifically, for a team of 30 salespeople generating €15 million in annual revenue, these gains represent an additional €2.8 million over 12 months, with constant sales effort.
Essential Sales Pipeline KPIs
Managing a sales pipeline modern sales pipeline relies on 5 essential KPIs. Pipeline coverage (ratio between pipeline value and period target) should be 3 to 4 to remain healthy. Velocity (average duration of an opportunity from start to end of cycle) should decrease over time if animation is effective. The stage-by-stage conversion rate (percentage moving to the next stage) identifies bottlenecks. The weighted pipeline (value × probability) provides the most reliable forecast. The stagnation rate (percentage of opportunities stagnant for more than N days) signals where attention is needed.
Simultaneous monitoring of these 5 KPIs on the sales dashboard provides a complete view of pipeline health. To delve deeper into integrating these indicators into a global dashboard, the dedicated article on sales force commercial KPIs details the dashboard's composition.
Use Case: Animated Sales Pipeline in B2B SaaS
An 80-person B2B SaaS company deployed an animated pipeline via Objow as an overlay to Salesforce. The raw pipeline already existed, but no animation managed it daily. Salespeople consulted their pipeline for weekly reporting and reviewed it quarterly, without daily interaction. The deployment added four layers: real-time ranking by value of opportunities in Stage 4, a weekly challenge on the number of opportunities progressed one stage, automatic alerts for stagnant opportunities, and a final sprint during the last 2 weeks of each quarter.
The documented result over 12 months: velocity decreased from 87 to 64 days (26% gain), conversion rate increased from 18% to 23%, and revenue grew by 31% with constant headcount. This performance validates the effect documented by HubSpot across 12,000 teams: +28% velocity and +19% conversion rate thanks to gamified pipeline animation. The raw CRM data didn't change; it was its daily activation that produced the performance.
To explore how this approach applies to your sales context, the "Boost Internal Teams" page documents deployments by organization type.
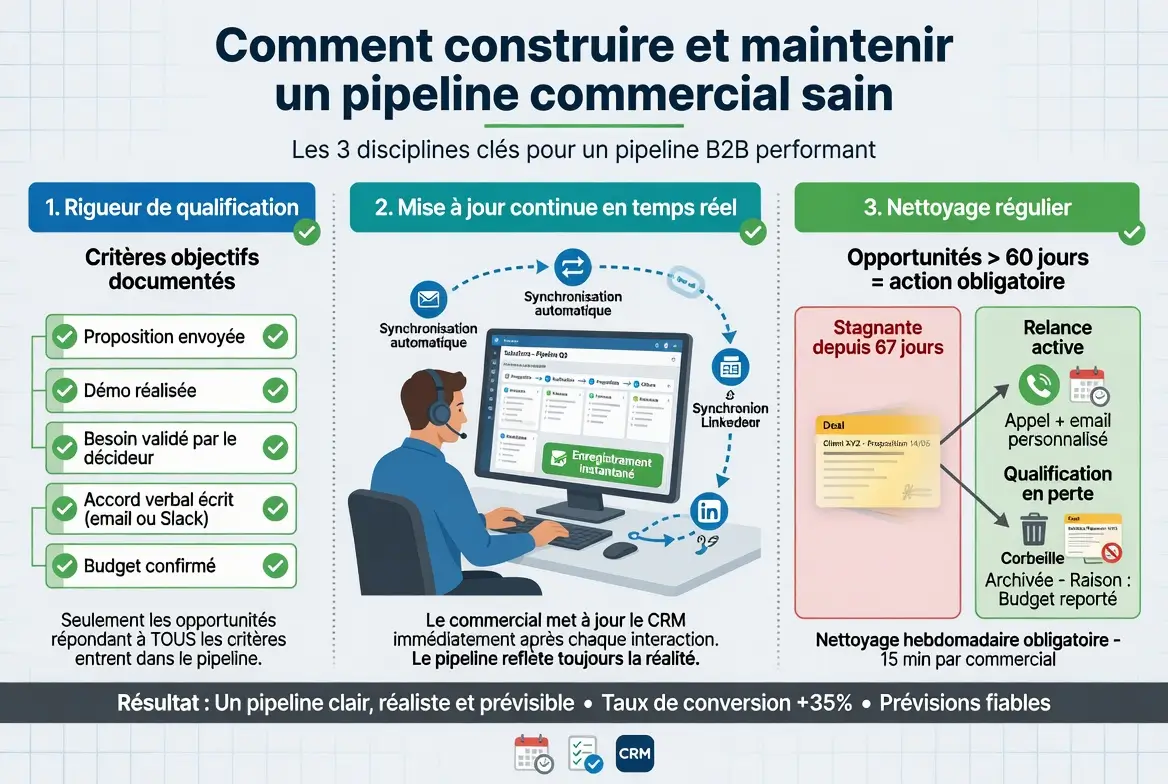
How to Build and Maintain a Healthy Sales Pipeline
Building a sales pipeline robust sales pipeline requires three disciplines. The first is rigorous qualification: each stage progression must be based on a documented objective criterion (proposal sent, demo completed, written verbal agreement). The second is continuous updating: the salesperson updates their pipeline in real-time, ideally via automatic CRM feedback, otherwise through daily data entry discipline. The third is regular cleaning: opportunities stagnant beyond 60 days must either be re-engaged or qualified as lost, never artificially maintained.
Furthermore, the pipeline benefits from being reviewed collectively each week as a team (pipeline review), with a focus on Stage 4 and 5 opportunities, which carry the most weight in revenue forecasting. This ritualization maintains collective discipline and allows for the identification of at-risk opportunities early enough to act. The pipeline review should remain short (maximum 45 minutes) and focused on significant opportunities, not exhaustive.
Ultimately, a healthy pipeline is an animated, updated, regularly cleaned, and collectively reviewed pipeline. To automate animation and free up time for strategic reviews, request an Objow demo and discuss your current pipeline structure with a consultant.
Frequently Asked Questions about the Sales Pipeline
What is the difference between a sales pipeline and a sales funnel?
The sales pipeline and sales funnel are sometimes used interchangeably, but they serve distinct purposes. The funnel represents the conversion ratio between stages (how many leads become prospects, how many prospects become customers), often visualized as a funnel. The pipeline represents the detailed list of ongoing opportunities, stage by stage, with their value. Specifically, the funnel is used to analyze conversion ratios and identify bottlenecks, while the pipeline is used to forecast revenue and manage opportunities daily.
How many stages should a B2B sales pipeline have?
The standard for a B2B sales pipeline is 5 to 7 stages. Fewer than 5 does not provide sufficient granularity for management, while more than 7 makes data entry cumbersome without analytical gain. The recommended structure combines prospecting, qualification, demonstration, proposal, negotiation, signature, sometimes followed by an onboarding or activation stage. Note that some sectors (commercial real estate, medical equipment) add specific stages related to regulatory validations. The practical rule: each stage must correspond to a clear change in conversion probability.
How to calculate the weighted value of the sales pipeline?
The weighted value of the Sales pipeline is calculated by multiplying the value of each opportunity by its conversion probability at its current stage, then summing the total. Specifically, a €50,000 opportunity at stage 3 (40% probability) contributes €20,000 to the weighted pipeline. This value represents the most reliable sales forecast available at any given time. It's worth noting that probabilities declared by sales reps are often optimistic (+15 to 25% according to Pipedrive), so it's useful to also calculate an adjusted weighted pipeline by applying a caution factor.
What sales pipeline coverage should you aim for?
A healthy coverage for a sales pipeline is 3 to 4 times the target for the period in question. Below 3, the pipeline is insufficient to meet the target, given average conversion rates. Above 4, the pipeline is likely inflated by poorly qualified or stagnant opportunities. The exact coverage depends on the average conversion rate: a team with a 25% overall conversion rate should aim for 4x, while a team at 35% can settle for 3x. Continuously monitoring this ratio is essential for anticipating peaks and troughs in activity.
How to reduce sales pipeline cycle time?
Reducing cycle time (velocity) relies on three complementary levers. First, identify the bottleneck stage through the conversion rate per stage: if only 30% of opportunities move from qualification to proposal compared to an expected 60%, coaching on qualification is necessary. Next, implement automatic alerts for stagnant opportunities (inactive for more than 14 days) to trigger a follow-up. Finally, boost velocity through a weekly challenge on the number of opportunities advanced to the next stage. The typical combined effect: a 25 to 30% reduction in overall cycle time.
Which CRM to integrate with a pipeline engagement platform?
The main CRMs on the market integrate natively with gamified engagement platforms: Salesforce, HubSpot, Pipedrive, monday CRM, Microsoft Dynamics 365, and Zoho. This integration allows for the automatic retrieval of opportunities, accounts, and activities, eliminating manual entry for sales reps. Objow offers these native connectors and displays the animated pipeline within the same interface as rankings, challenges, and alerts. Specifically, sales reps manage their pipeline and its engagement within a single tool, which is essential for the daily sustainability of the system.
The modern sales pipeline goes beyond a simple reporting tool. It becomes a daily engagement system that drives velocity and conversion rates. To transform your pipeline into a performance driver, request an Objow demo and discuss the structure of your current sales cycle with a consultant.


.webp)